Real estate at risk of contracting in Eastern Canada amid mortgage credit slump
August 19, 2019
Erik Fertsman
National home prices are now contracting for the first time since 2009, and, as I covered a few days ago, things in Atlantic Canada are not fairing so well, either. But, Canada is a territorially large country, and not all regions are experiencing the same degree of declines. Eastern Canada, generally speaking, has been a bulwark of upwardly opportunities for Canadians.
This has particularly been the case for Ontario, where folks have enjoyed super high rates of growth in home prices. They have massively outstripped wage growth, as I've previously shown. Even, Quebec, the other half of the eastern Canadian region, has witnessed a nice ride in home price growth that has also managed to outpace the realities of weekly wage earnings.
As of the beginning of this year, however, home price growth has really begun to suffer in the region. Not as badly as Atlantic Canada, where you can find 3 years worth of home price contractions. For the most part, though, growth is bucking the trend, to the point where real estate is now at risk of contracting in Eastern Canada. In other regions I've shown you how weak and falling growth rates are linked to what's going on in the residential mortgage credit market. In Eastern Canada, there's more of the same.
Article continues below.
Where we are with home prices in Eastern Canada
Last week, Stats Can released its June home price index data, and since then, we've been breaking things down beyond the national level to get a good look at what's happening between regions and provinces. Here's the data for Eastern Canada:
Just like Atlantic Canada, the data for Eastern Canada paints a worrying picture for home owners in Ontario and Quebec. Previously, Quebec (orange line) was getting by on a decent footing, but now, price growth has begun to slump back toward 1 percent. The problem with this is that it's the middle of the summer housing sales season, and growth is now coming in below the winter (February) low of 1.768 percent.
The data for Ontario (teal line) is worse, with growth coming in around 0.5 percent. This is Canada's largest and richest province. Growth is merely floating sideways after briefly entering negative territory back in January of this year. There doesn't seem to be a profound upswing in this summer's sales season, with volatility pretty suppressed. It remains to be seen whether or not home price growth will break back up toward the growth trend, which sits well above 3 percent.
Importantly, we can see how CMHC's 5-year conventional rate is falling, but it's not helping home price growth. So, what's happening here in these provinces? Clearly, home prices seem to be following the national residential mortgage credit growth rate (grey columns)!
Here's how home prices are trending with mortgage credit in Ontario and Quebec
As you know, I was able to find some provincial mortgage credit statistics buried in Stats Can's database. These figures are good because they offer a better glimpse at the relationship between home prices and mortgage credit at the provincial level. This adds precision to our understanding about the overall relationship between these two factors.
Unfortunately, the provincial stats are quarterly, so the most recent figures are missing. Luckily, we will see the second quarter figures later this week. Right now, we're missing about 4 months worth of numbers. Nevertheless, here's the chart:
Check out how home price growth has been trending alongside mortgage credit growth. Back in January 2018, mortgage growth began to descend, and home price growth followed. Historically, it seems, home prices tend to descend when mortgage growth breaches below the 6 percent year-over-year growth level.
Interestingly, home price inflation seems to really struggle below 6 percent. It's worth remembering how this is a quarterly figure, so it's a bit hard to compare with the monthly home price data on the chart. In Q1 2019, mortgage credit growth registered in around 4.7 percent, yet prices went into contraction.
This goes to show you just how much credit growth is needed to sustain price expansion in Ontario every quarter. This is a huge amount of credit; the Ontario mortgage market clocks in at over $500 billion CAD. That's nearly four times the size of the Bank of Canada's balance sheet. An expansion of a mere 5 percent in mortgages is worth about $25 billion CAD!
Article continues below.
No less, the quarterly mortgage statistics jive well with the monthly housing data at the end of each quarter. Here, take a look at this fancy chart I've put together that shows you the relationship between Ontario's residential mortgage credit (total in Canadian dollars) and Ontario home prices (using Stats Can's index):
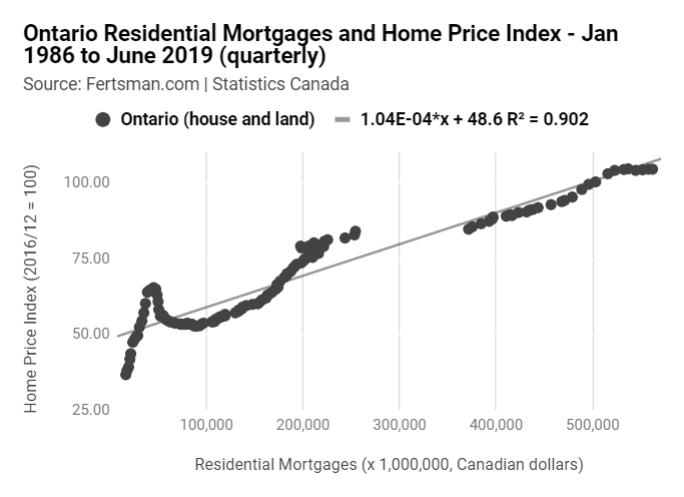
The relationship between the two variables are significant, registering an r-squared value of 0.902. As I've said before, for Ontario it really doesn't matter how large the
national credit market is: it's all about how much credit gets doled out at the
provincial level.
Some folks are wondering what it would take for home prices in places like Toronto to climb higher. Well, we can use the equation in the chart above generated from the provincial statistics, and find out approximately how much prices would rise if, say, we saw another 10 percent increase in mortgage credit.
Ontario's mortgage market, as of the first quarter of this year, had a market capitalization of $536 billion CAD. This is a huge slice of the $1.2 trillion CAD national mortgage market. A 10 percent increase in Q1 mortgage credit would equal $590.208 billion CAD. That's an increase of nearly $54 billion CAD in total mortgage credit. Stick that into our equation:
(0.000104 x 590,208) + 48.6 = 109.98
As of Q1, Toronto registered a 104.6 on Stats Can's index. Therefore, a 10 percent increase in mortgage credit could boost home prices by 5.14 percent and land 109.98 on the index. As of June, Ontario recorded a 104.7 on the index. So, if we think ahead a little bit in anticipation of the second quarter mortgage data, I'd be willing to say we've got a bit of a problem getting the market capitalization up. Somethings going on in the mortgage market. Either folks don't want to buy a home, or they can't get a mortgage.
But, what's happening in Quebec? I've put together the same fancy chart for that province, as well. Take a look:
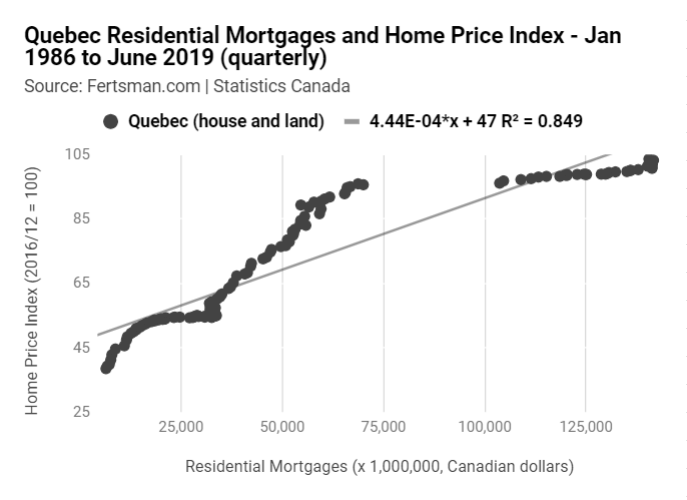
Mortgages and home prices are significantly correlated in Quebec, with an r-squared value of 0.849. It's a bit lower than the one we get for Ontario, and I suspect this is because the Quebec market has less economic mass. When something has a smaller economic mass, it tends to experience more volatility. In the chart above, we get a bit more over and under-shoot in the price of home relative to mortgage credit in the market.
As a result, we get a slightly smaller r-squared value, as mortgage credit and home prices have less of a linear relationship. Perhaps, if we wanted to complicated things a bit more, we could give the chart a logarithmic "line of best fit" and equation. This would add an effect to those charts where higher mortgage credit levels results in slightly lower price increases.
In other words, more credit would disproportionately effect home price growth rates. We tend to see this in classic market "top" formations where added participation fails to really stimulate price increases. I suspect that Quebec would need to see substantially larger quantities of credit entering the home market to keep home prices increasing at their historical paces.
What should we expect for home prices?
The second quarter statistics will be vital to understand more fully what's going on at the provincial level. Unless something changes where there's lots more credit getting pumped into the markets via bank issued mortgages, thing are likely to linger sideways. In the event credit really starts to stall, it's going to really drag down home prices.
With the yield curve inverting in the government bond yield markets, and global trade significantly slowing relative to GDP, bank mortgages could really get dragged down. Eastern Canada is also facing declining consumer credit growth and a significant deterioration in manufacturing, aside from the mortgage slump. These are major headwinds, as Ontario and Quebec are highly dependent on consumer spending and manufacturing output.
A Canada wide recession is looming, as financial and economic statistics suggest. Interest rates are falling, and they follow growth. Meanwhile, wages are still struggling and asset prices are beginning to fall. Having a combination of banks looking to survive a recession, and folks with higher debt-to-asset ratios and stagnant wages, you create a situation where mortgage credit quantities are unlikely to rise. This is, particularly, at a time when people are struggling with housing affordability in key areas like Toronto and the surrounding areas.
The bottom line: brace yourself for downside in the event bank credit deteriorates.
SHARE THIS ARTICLE
Enjoyed this article and want to support our work, but are using an ad blocker? Consider disabling your ad blocker for this website and/or tip a few satoshi to the address below. Your support is greatly appreciated.
BTC Address: 13XtSgQmU633rJsN1gtMBkvDFLCEBnimJX