Exclusive: Why bank credit is the predictor of home prices, not interest rates
August 13, 2019
Erik Fertsman
Money is cheap these days in advanced economies, and I mean really cheap. Unlike 20 or 30 years ago, you can now get a real interest rate of 2 to 4 percent on pretty much any big ticket item. Homes are being financed for these kinds of rates, businesses are tapping into loans at these prices, and consumers are often able to finance a brand new car purchase at zero percent, that's even lower! Unsecured personal lines of credit can hover around 5 percent.
Even though interest rates for companies and consumers are basically hovering closer to zero than at any previous moment in time, everyone seems confused as to why our economies are experiencing weak growth. Lowering interest rates is supposed "spur" economic growth according to economists, pundits, and economic textbooks. Logic dictates that cheaper money encourages people to spend more on goods and services, invest in productive business (because you're not going to get much of a return holding your money in a bank account), and help those with high debt-to-income ratios with their spending.
Borrowing money for a car costs nothing these days, but car sales have been declining since 2013. Gross domestic product (GDP) in all advanced economies is coming in quite shy of historical performance, when double digit economic growth coincided with double digit interest rates. In Europe, rates have gone negative, but European economic growth is contracting. Folks are now even
writing how the latest interest rate cuts in the US are not helping the US housing market.
Article continues below.
The weird situation in the Canadian housing market
The situation is even weirder in Canada, where low rates over the last two years has not helped a consolidating housing market. So, what the heck is going on? Shouldn't lower interest rates help more people buy a home and boost prices?
Last week I reported
how home prices in Canada have begun contracting, as measured by Statistic Canada's home price index. This is the first time home price growth, measured in terms of the price of homes at the same time the previous year, has entered negative territory since late 2009. Here's the chart, below:
Home prices are now contracting, but interest rates remain historically-low. Actually, based on the chart above, housing price growth seems relatively correlated to interest rates (you can see growth going down as interest rates trend downward between 2009 and 2016). This is breading a head-scratching situation for economists, analysts, and regular people who are just trying to get by, but are stuck with the bombarding notion that lower interest rates help raise the price of homes. Do you buy a home when interest rates drop?
But, wait, what's that gray shaded information that looks like mountainous terrain on the chart? That's Canadian residential mortgage growth, measured in Canadian dollars. More mortgage growth means more money has been lent out for the purpose of purchasing a home. Since this growth has remained positive for a while, we've ended up with a massive dollar figure. In Canada, total outstanding mortgage credit is measured in the trillions! Total loans in Canada don't even add up to 3 trillion. So, about 1/3 of all credit issued in Canada has gone toward home owners.
It just so happens that Canadian housing prices have experienced one of the largest growth cycles the world has ever seen. Home prices have gone absolutely crazy relative to wages, as I've written about, extensively. Here's the kicker, though: from the chart above, home price growth is much more visibly correlated with mortgages than with interest rates.
How interest rates are poorly correlated with home prices
The correlation between home prices and interest rates is quite terrible. And if you're working for a company or organization trying to figure out where things are heading based on the cost of credit, you'll likely come up with some bad strategies and conclusions. Check this out:
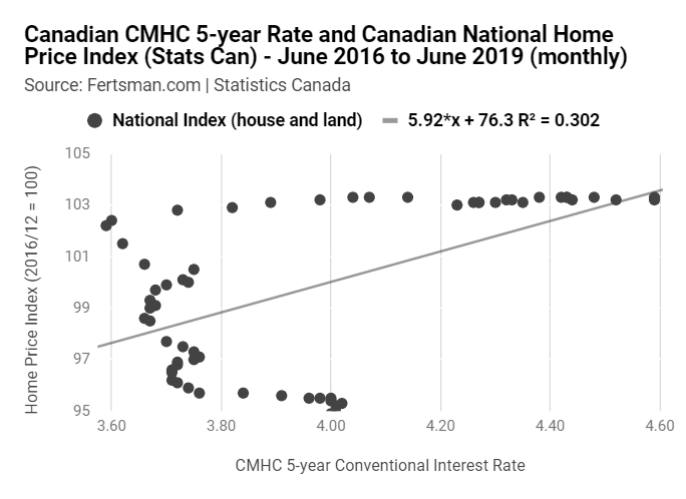
I've created a chart using CMHC's 5-year conventional mortgage rate and Statistics Canada's home price index for the last 3 years. It's supposed to show you the relationship between these two things; interest rates and home prices.
The result? Well, there's an r-squared value of 0.302, which is not very good as you'll see further below. The line running through the chart is also not very representative of what conventional thinking tells us. The line is supposed to run downward if higher interest rates mean lower home prices. Instead, the line of "best fit" seems to be telling us that there's a positive correlation, where higher interest rates are supposed to result in higher home prices. Oh my!
Basically, looking at mortgage rates as a factor in determining home prices over the last three years has been useless. But the Bank of Canada and other Canadian agencies have decided that interest rates are an effective tool to "steer" the home market anyway. Even the Federal government led by Justin Trudeau's Liberals think a first-time home buyer program
that will offer a zero percent and principal-free loan will help boost home prices. It might, but according to the data above, not because it's interest free.
Article continues below.
How mortgages are significantly correlated with home prices
This probably won't come as a surprise to you if you've been following my articles here on fertsman.com. Recently, I've really tried to hammer away at the correlation between mortgage credit issued by Canadian commercial banks and home prices. I didn't show a lot of the work previously, because I wanted to focus on the fundamental data and logic behind why there's a strong relationship.
With the latest data on home prices from Stats Can showing quite the deterioration in growth, it's time to show you. Below is a chart that gives you an accurate representation of the relationship using Statistics Canada's national home price index and total national residential mortgages issued by the commercial banks. I've even thrown in an equation:
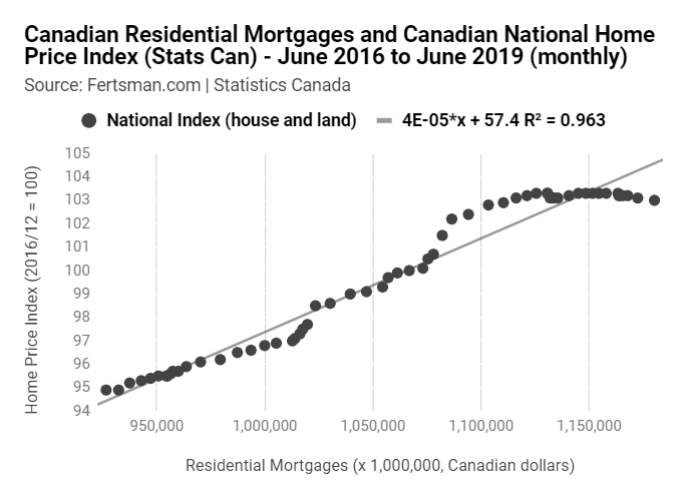
An r-squared value of 0.963 is a much more robust figure than the one we got for interest rates, which ended up being a confusing one anyway. Here, we can see how the quantity
of mortgage credit measured in Canadian dollars is very positively and linearly correlated with home price growth. So, really, we don't need to look at any other variables, because mortgage credit statistics explain growth to a statistically significant degree.
So, if you wanted to predict where national home prices are going, take a calculator out, enter the total amount of residential mortgage credit you think there might be in 3 years, multiply that figure by 0.00004, add 57.4, and you'll get a figure in terms of Stats Can's index. Mortgage credit has gone up about 25 percent over the last three years. We could do something like this:
(0.00004 x 1,437,500) + 57.4 = 114.9
If mortgage credit reaches $1.4375 trillion in 2022, then Stats Can's home price index could be 114.9. As of June, the index sits at 103. So, that growth in credit would make the index jump 11.5 percent.
In case you're not a big fan of Stats Can's index, we can use a different one:

Using data from Teranet and the National Bank of Canada, we get a slightly better r-squared value! The math is a bit different as well:
(0.00028 x 1,437,500) - 98.3 = 304.2
If mortgage credit reaches $1.4375 trillion in 2022, then the TNBC home price index could be 304.2. As of June, the index sits at 224.96. So, our predicted growth in credit would make the index jump 35 percent! If you become a home owner today, you'll be sitting on quite a bit of equity.
But, of course, if you remember the first graph at the top of this article, mortgage credit growth has been trending downward since January 2018. In order to get to that crazy mortgage number we came up with above, things need to turn around, and fast. Otherwise, prices are going to make a break to the downside, and then all those hopes and dreams are over.
The bigger thing that I hope you take away with you after reading (or listening to this article) is that interest rates don't steer home prices, bank credit quantity does. Hopefully, those working in our commanding heights manage to figure this out sooner or later, especially given the risks of a recession. During recessions, credit growth contracts sharply... and this time the effect on the housing market in Canada could be severe.
Cover image source: Jon Cellier
SHARE THIS ARTICLE
Enjoyed this article and want to support our work, but are using an ad blocker? Consider disabling your ad blocker for this website and/or tip a few satoshi to the address below. Your support is greatly appreciated.
BTC Address: 13XtSgQmU633rJsN1gtMBkvDFLCEBnimJX