Home price growth is contracting in Atlantic Canada amid mortgage credit slump
August 15, 2019
Erik Fertsman
While home prices are contracting at the national level, it doesn't necessarily reflect what's happening in each province. Canada is a huge country, with lots of diversity between its various regions. Some have experienced crazy asset price inflation in real estate, while others have seemly muddled along. That's not to say that "muddling along" results in affordable housing prices. In fact, as I
reported a fortnight ago, home prices, even in some of the most tame markets, have still managed to outpace wage growth. It's been amazing to watch.
These more tame markets can be found in Atlantic Canada, where home price growth looks terrible when compared with Eastern Canada or even Western Canada. Still, real estate has managed to outpace wage growth in Nova Scotia over the last 10 years, for example, where the bulk of the Atlantic Canadian population is concentrated. But now, home price growth is starting to suffer, and in some cases like Newfoundland and Labrador, home prices have been shrinking over the last 3 years. And it all comes down to mortgage credit...
Article continues below.
How badly home price growth is contracting in Atlantic Canada
Last week, Statistics Canada came out with its home price index data for June. This data can be broken down beyond the national level in order to get a better gander at what's happening at the provincial level. Take a look:
It's a bit of a worrying picture for home owners in the four Atlantic provinces. Nova Scotia (dark red line) reported a growth figure of 0.69 percent for June. But this is the peak of the summer housing sales season, and growth is barely coming up against the February high of 1.09 percent during the winter blues.
The data for New Brunswick, the second largest province in the region, is even worse. Growth is in contraction this home sales season. Only the tourist destination and agriculture province of Prince Edward Island is posting a positive upswing outside of Nova Scotia, but this is following a period where real estate contracted during the winter and spring months. It remains to be seen whether or not home price growth will break even this year.
Meanwhile, Newfoundland and Labrador is basically in a housing bear market. Prices have been contracting there since July 2016. That's three years of bear market. What's happening here and across the region? Well, the provincial house price growth rates seem to be closely following the national residential mortgage credit growth rate. A-ha!
Nova Scotia real estate and mortgage growth
Buried deep in Statistics Canada's database I managed to find some provincial mortgage credit statistics. The reason we are chasing these figures, as you know, is because there's a pretty good correlation between bank mortgage credit and home prices.
Now, the data is not ideal, as the provincial mortgage credit statistics are quarterly. The most recent figures I could find were for the first quarter of this year. We're missing about 4 months worth of numbers in order to get a more precise look at the credit market and match our monthly home price data. Nevertheless, here's the chart:
The trends are obvious. Look at how mortgage credit growth has been declining since the 1990s. Interest rates have followed this declining trend. Interestingly, we can see how interest rates spike over short periods when lots of home credit was getting doled out, indicating the banks were able to take small advantages of the demand for mortgages and charge higher interest. Remember that the spike in 2011-2013 was due to an accounting standard change the banks experienced. So we need to ignore that data.
More importantly, we can now begin to better understand why home price growth has been declining in Nova Scotia since the 1990s. It's because mortgage credit growth has been declining since then, and even contracting throughout a number of quarters. Look at the data for the last 5 years: you can see how low mortgage credit growth has been. This is reflected in the home price growth data.
Article continues below.
Of course, the mortgage and home price data is not perfectly correlated. But for you folks who need more evidence of the matter at hand, I've put together this fancy chart that shows you the relationship between Nova Scotia's residential mortgage credit (total in Canadian dollars) and Nova Scotian home prices (using Stats Can's index). Here it is:
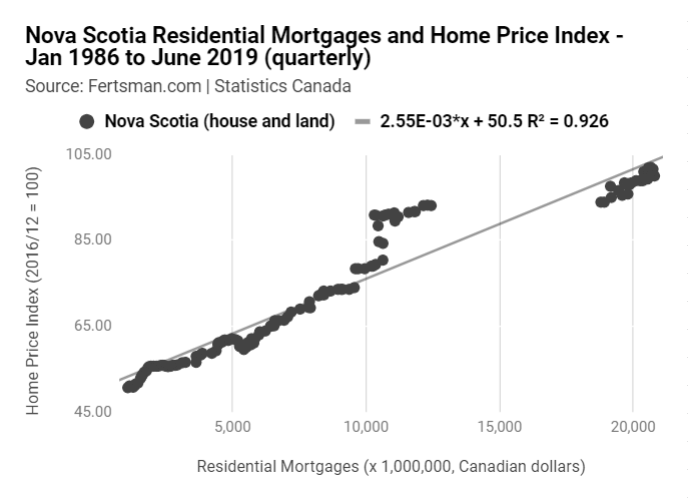
The relationship is quite significant, registering a r-squared value of 0.926. About $20 billion CAD worth of credit has been issued in Nova Scotia to get home prices to where they are now. This is a huge pile of money, but only a tiny slice of the $1.2 trillion CAD national mortgage market.
At the end of the day, though, it really doesn't matter how large the national credit market is. It's all about how much credit is getting doled out at the provincial level. And more recently, as the previous chart showed us, credit growth has been anemic and, at times, contracting in Nova Scotia. In order for prices to keep going up, the quantity
of mortgage credit needs to rise.
Now, you're probably wondering what's going on in the other Atlantic Canadian provinces. So, I've put together some fancy charts for those provinces, as well:
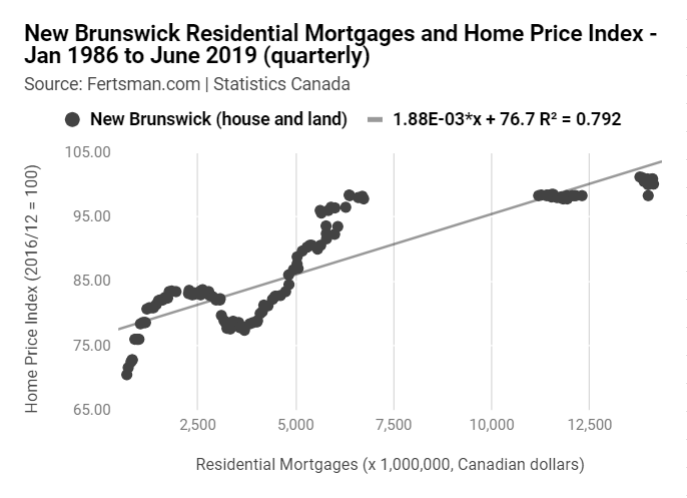
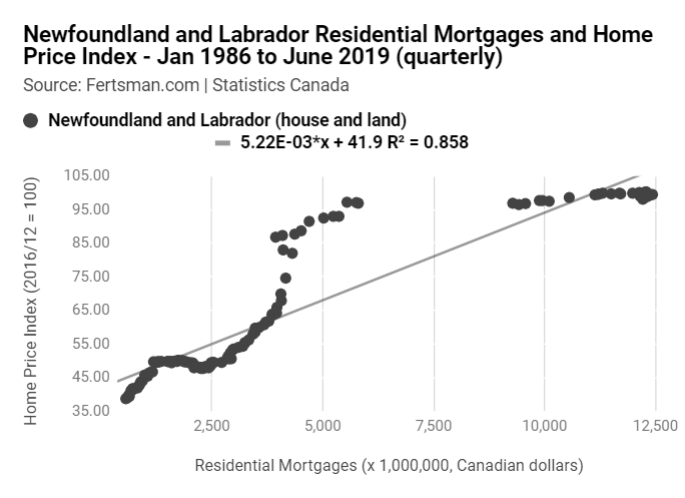
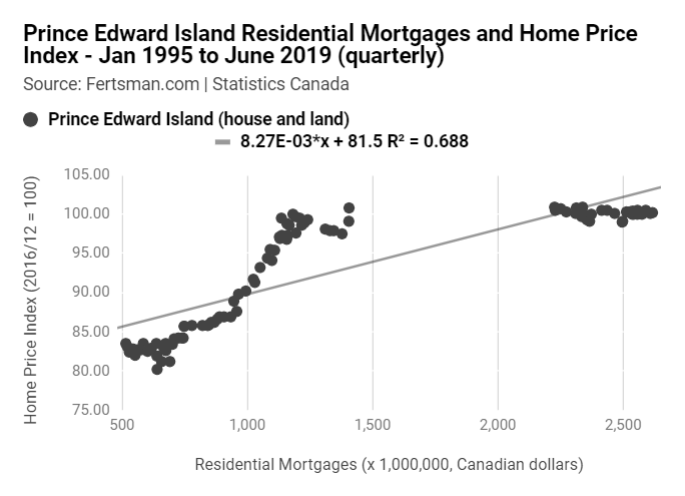
One thing to note, is that the r-squared valued are lower for these provinces when compared with Nova Scotia. Mortgage statistics are still quite significantly correlated with home prices, so don't get the idea that mortgage credit is not important. However, these provinces show us that home prices can be potentially explained by other factors.
I suspect these provinces have a slightly higher degree of home buyers who used non-bank credit and more savings (bank deposits) when purchasing a home. Research shows, though, that assets purchased with existing bank deposits (non-bank credit is also, technically, existing money), that inflation in those assets are not as severe as assets exposed to bank issued credit (which is money created out of nothing). So, to be clear, this is just a theory that I have yet to collect data on, and confirm.
Another way to look at things in these provinces, and explain the more volatile nature of house prices (where prices fluctuate more against similar quantities of credit), is to see these markets as if they're "emerging." This is something we see in small markets when compared with larger ones; the same dollar tends to influence prices more in the former markets. You can see how Newfoundland and New Brunswick's mortgage credit market is about half the size of the one in Nova Scotia. And, Prince Edward Island is a merely a fraction of Nova Scotia's credit market size.
As a result, the r-squared values are lower, as mortgage credit and home prices have less of a linear relationship. It seems the relationship is more logarithmic. So we'd have to add an effect to those charts, where higher mortgage credit levels results in lower price increases. In other words, more credit disproportionately effect home price growth rates. That would mean that, in those provinces, credit quantities now need to be substantially higher in order to keep home prices increasing at their historical paces. However, it's best to keep things simple and linear.
So, what does this all mean for home prices?
Unless something changes where lots more credit is pumped out through bank issued mortgages, things are unlikely to change the current trend of contracting home prices in Atlantic Canada. One way this could happen is with an influx of migration of skilled workers from other Canadian regions into Atlantic provinces, or an influx of skilled immigrants from outside of Canada. These folks would probably enter the local job markets and take out mortgages to buy homes around current prices.
Unfortunately, Atlantic Canada is facing a number of headwinds. The working population in Atlantic Canada is actually shrinking, outside of the urban city of Halifax. A Canada wide recession is looming, as financial and economic statistics suggest. Interest rates are falling, and they follow growth. Meanwhile, wages are still struggling and asset prices are beginning to fall. If you have a combination of banks looking to survive a recession, and folks with higher debt-to-asset ratios and stagnant wages, you create a situation where mortgage credit quantities are unlikely to rise. This is, particularly, at a time when people are struggling with housing affordability.
The bottom line: brace yourself for more of the same and even falling home prices as bank credit continues struggle.
Cover image by: Tim Foster
SHARE THIS ARTICLE
Enjoyed this article and want to support our work, but are using an ad blocker? Consider disabling your ad blocker for this website and/or tip a few satoshi to the address below. Your support is greatly appreciated.
BTC Address: 13XtSgQmU633rJsN1gtMBkvDFLCEBnimJX