What Statistics Canada just said about "debt and financial distress among Canadian families," and how debt-to-income could be misleading
July 1, 2019
Erik Fertsman
A few days ago Statistics Canada (Stats Can) pushed out their
study on "Debt and financial distress among Canadian families" using data from the 2016 Survey of Financial Security. The study didn't focus on bankruptcy as an indicator of financial distress, but on the initial stages of delinquency: failure to pay debts on time. And this makes a lot of sense because bankruptcy is a form of extreme financial distress, whereas delinquencies are broader and are experienced by a larger subset of households.
Stats Can focused on three main indicators (dependent variables): 1) mortgage payments missed or skipped; 2) non-mortgage payments missed or skipped; and, 3) whether a payday loan was used. All three indicators took self-declared data for 2016, only.
Financial stress and delinquencies are behavior-altering, and in a lot of ways, a precursor to bankruptcy. This stress eventually transmits downward to creditors like banks, who end up holding non-performing loans. It also puts a drag on the economy, so you can bet financial institutions and those regulating them, like the Bank of Canada and the OSFI, are paying close attention to this data- at least they should be.
Debt-to-income ratio and financial distress
Debt-to-income ratios have significantly increased in recent years, to the point where, now, Canadians are one of the most indebted households on the planet. This ratio has also been at the center of mortgage rule changes in Canada, and is suspect of causing a significant drop in the quantities of "high-ratio mortgages" across the country underwritten by the big six banks and other smaller lenders. If you don't recall, I wrote about this here
and how it's impacting home prices.
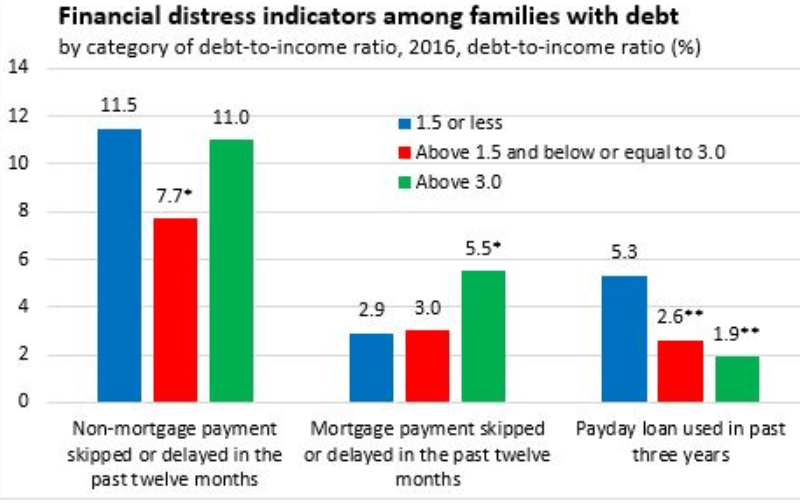
So, Stats Can ran debt-to-income against their financial distress indicators, but the associations were not clear (see the chart above). First, nearly the same percentage of folks with ratios of 1.5 or less reported skipping or delaying a non-mortgage payments as those with ratios of 3 or more (actually, slightly more). Second, more people with ratios of 1.5 or less reported using a payday loan over the last 12 months in comparison to those with higher debt ratios (!). Both of these findings are a bit counterintuitive. Although, those with higher ratios did report skipping or delaying a mortgage payment.
Debt-to-asset ratio and financial distress
While debt-to-income is a key indicator, it's only one side of the story. And, besides, the ratio against two out of the three indicators explored above demonstrated some odd results. So, it may not be the best independent variable to look at all the time, especially in an isolated way. For this reason, Stats Can incorporated the debt-to-asset ratio to get a measure of household "resilience" to financial pressures.
Interestingly, households that reported higher levels of debts-to-assets also reported having a variety of financial problems such as delays on debt payments, skipping debt payments, loading up on more debt to pay debt by using payday lenders, or a mixture of all of these.
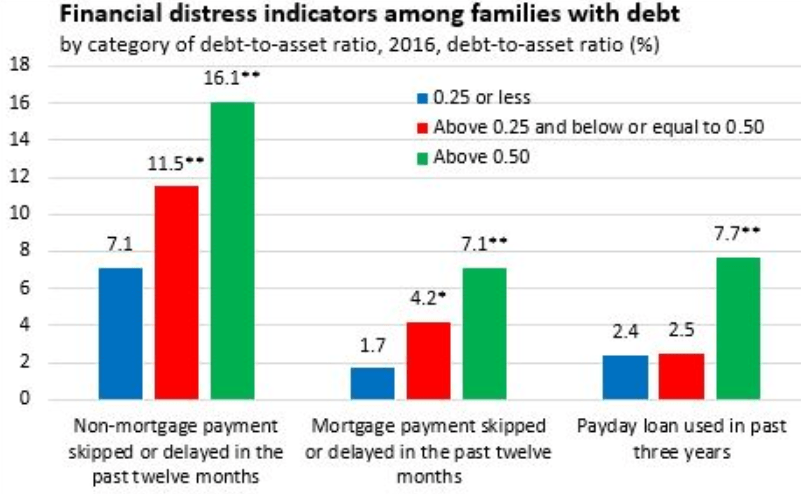
As you can see above, households with higher debt-to-asset ratios were, across the board, more likely to be in financial distress. In fact, a higher ratio was statistically associated with the indicators, whereas the debt-to-income ratio wasn't. Of course, it should be noted that the data used was self-reported, and that skipping or delaying a payment is not always an indicator of financial distress because a missed payment could be due to human error.
What can we see from the data?
One of the most interesting findings in the Stats Can study, is how homeowners had lower probabilities of delaying or skipping on non-mortgage related debt when compared with those who did not own their dwelling. This kind of helps us make sense of the results that show how those with lower debt-to-income ratios were more likely to skip or delay a non-mortgage payment or use a payday loan.
One way of interpreting this is that those with a mortgage or higher debt-to-income could have the ability to leverage the equity in their assets to continue regular debt payment- that is, if their assets have value, and of which they have equity in. If true, at least part of the time, one question would be: how long will this last before these folks strip their assets of equity or the possibility of asset prices falling? And what could the 2017 and newer data reveal to us now, given that home prices have been pretty flat (and in some cases, falling) since the summer of 2017?
What's more, the study flagged how families in the bottom 20 percent of the income bracket (after tax) were also more likely to delay or skip payments of non-mortgage debts than those in the top 20 percent. Single parents were three times more likely to use payday lenders than couples with no children, and were the most likely to delay or skip a mortgage payment (!). This is a clear highlight of some of the most financially vulnerable in Canadian society: single parents, and the bottom 20 percent.
This subset of people could very well be in various debt-to-income ratios, because some might have low income but decent asset values, while others might have low income and terrible asset values. So, responding to financial distress based on debt-to-income could do more damage than good. Kudos to the Stats Can study for flagging the importance of debt-to-asset, and the fact that, even if people have low debt-to-income ratios on paper, if their assets are worth close to nothing they could still turn out to be high risk borrowers and miss or delay a debt payment.
Unfortunately, the Canadian government wants to keep the real estate asset bubble going, for example, by introducing a new first-time home buyer's incentive program slated to begin in September of this year, right before an important federal election. While many are dependent on their asset values to increase year-over-year, month-over-month, the problem with the debt-fueled asset price inflation boom in homes is that it's causing a whole subset of Canadians, who don't necessarily have high debt-to-income ratios, to seek delays or miss debt payments. Worse, people are being forced to seek payday loans and usurious interest rates because they have been priced-out of home ownership and, by extension, have little asset value to lean on against that which to borrow, and in effect, keep up with the Jones'.
SHARE THIS ARTICLE
Enjoyed this article and want to support our work, but are using an ad blocker? Consider disabling your ad blocker for this website and/or tip a few satoshi to the address below. Your support is greatly appreciated.
BTC Address: 13XtSgQmU633rJsN1gtMBkvDFLCEBnimJX